How many units do you need to sell to stop losing money?
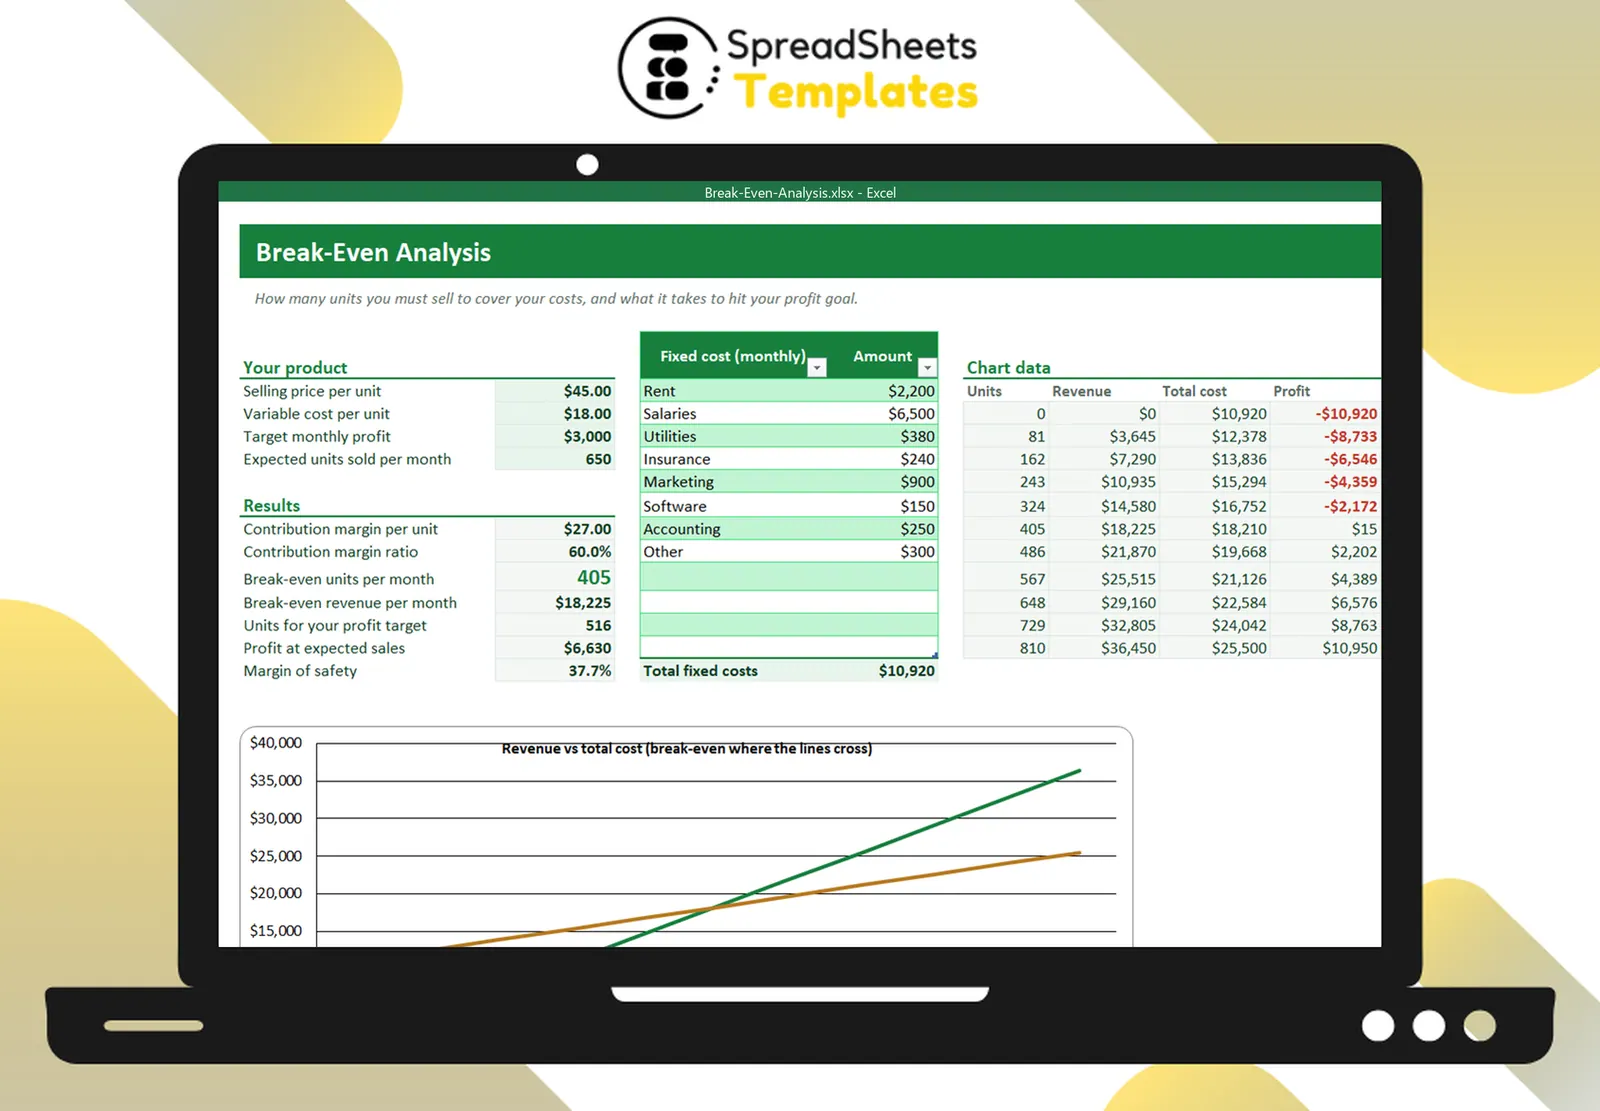
Type your price, variable cost and fixed costs. Get the break-even point in units and revenue, the sales needed for your profit goal and a chart where the lines cross.
- ⚡ Instant download
- 🔒 Secure checkout by Stripe
- ↩️ 7-day guarantee
Sound familiar?
- You are not sure if your price covers all your costs
- You set sales goals by gut feeling
- Investors or the bank ask for a break-even analysis
The Break-Even Analysis fixes that in a few minutes, for $2.
What changes when you use it
Your break-even point
In units and in revenue per month, calculated from your real costs.
Sales needed for your goal
Type a monthly profit target and see how many units it takes.
Test prices and costs
Change the price or the variable cost and watch the break-even move.
A chart that explains it
Revenue vs total cost — everything right of the crossing point is profit.
What's inside the spreadsheet
- Price and variable cost per unit
- Fixed cost list (12 lines)
- Contribution margin per unit and ratio
- Break-even units and revenue
- Units for profit target
- Profit at expected sales and margin of safety
- Chart of revenue vs total cost
- How to use tab
Ready in 3 simple steps
Buy securely
Pay $2 once through the secure checkout (Stripe).
Download instantly
Your file is ready right after payment and also arrives in your e-mail.
Fill in and use
Open it in Excel, type your data and let the formulas do the work.
Made for
Everything you get
- Break-Even Analysis (.xlsx file), 100% editable
- Instant download right after payment, plus the link in your e-mail
- Use it on as many of your own computers as you need
- No subscription and no monthly fees, ever
- Free e-mail support to help you get started
- 7-day money-back guarantee
Works with: Excel 2010 or newer on Windows or Mac · also opens in Google Sheets
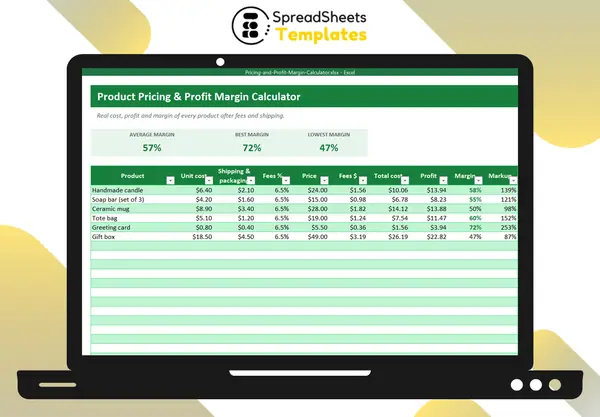 Set the right price per product with the Pricing & Profit Margin Calculator.
Break-Even Analysis
$2
A $2 answer to the most important question in your business.
Download nowFrequently asked questions
Does it work for services?
Yes. Use one hour or one project as the “unit”.
What if I sell several products?
Use an average price and average variable cost, or make one copy per product.
Is it monthly?
The example is monthly; use yearly numbers if you prefer, consistently.
How do I receive the spreadsheet?
Right after payment you get the download link on screen and by e-mail. Lost it? Get new links anytime on the "My downloads" page.
Which software do I need?
Microsoft Excel 2010 or newer (including Microsoft 365) on Windows or Mac. It also opens in Google Sheets and LibreOffice, although some formatting may look slightly different.
Can I edit it and add my logo?
Yes. The file is not locked: you can rename labels, add rows and put your own logo in it.
What language is the file in?
English.
Is it a subscription?
No. You pay $2 once and the file is yours to use for as long as you want.
What if it is not what I need?
You have 7 days to try it. If it does not meet your needs, write to us and we will help you, exchange it for another template or refund your payment.
More about the Break-Even Analysis
Type your price, variable cost and fixed costs. Get the break-even point in units and revenue, the sales needed for your profit goal and a chart where the lines cross.
What's inside
- Price and variable cost per unit
- Fixed cost list (12 lines)
- Contribution margin per unit and ratio
- Break-even units and revenue
- Units for profit target
- Profit at expected sales and margin of safety
- Chart of revenue vs total cost
- How to use tab
Works in Microsoft Excel 2010 or newer (Windows and Mac) and opens in Google Sheets. One-time payment, instant download.
Get organized today for just $2
Download the Break-Even Analysis now and start using it in minutes.
Download now for $2One-time payment · Instant download · 7-day guarantee