See your whole portfolio — value, returns and dividends — on one dashboard
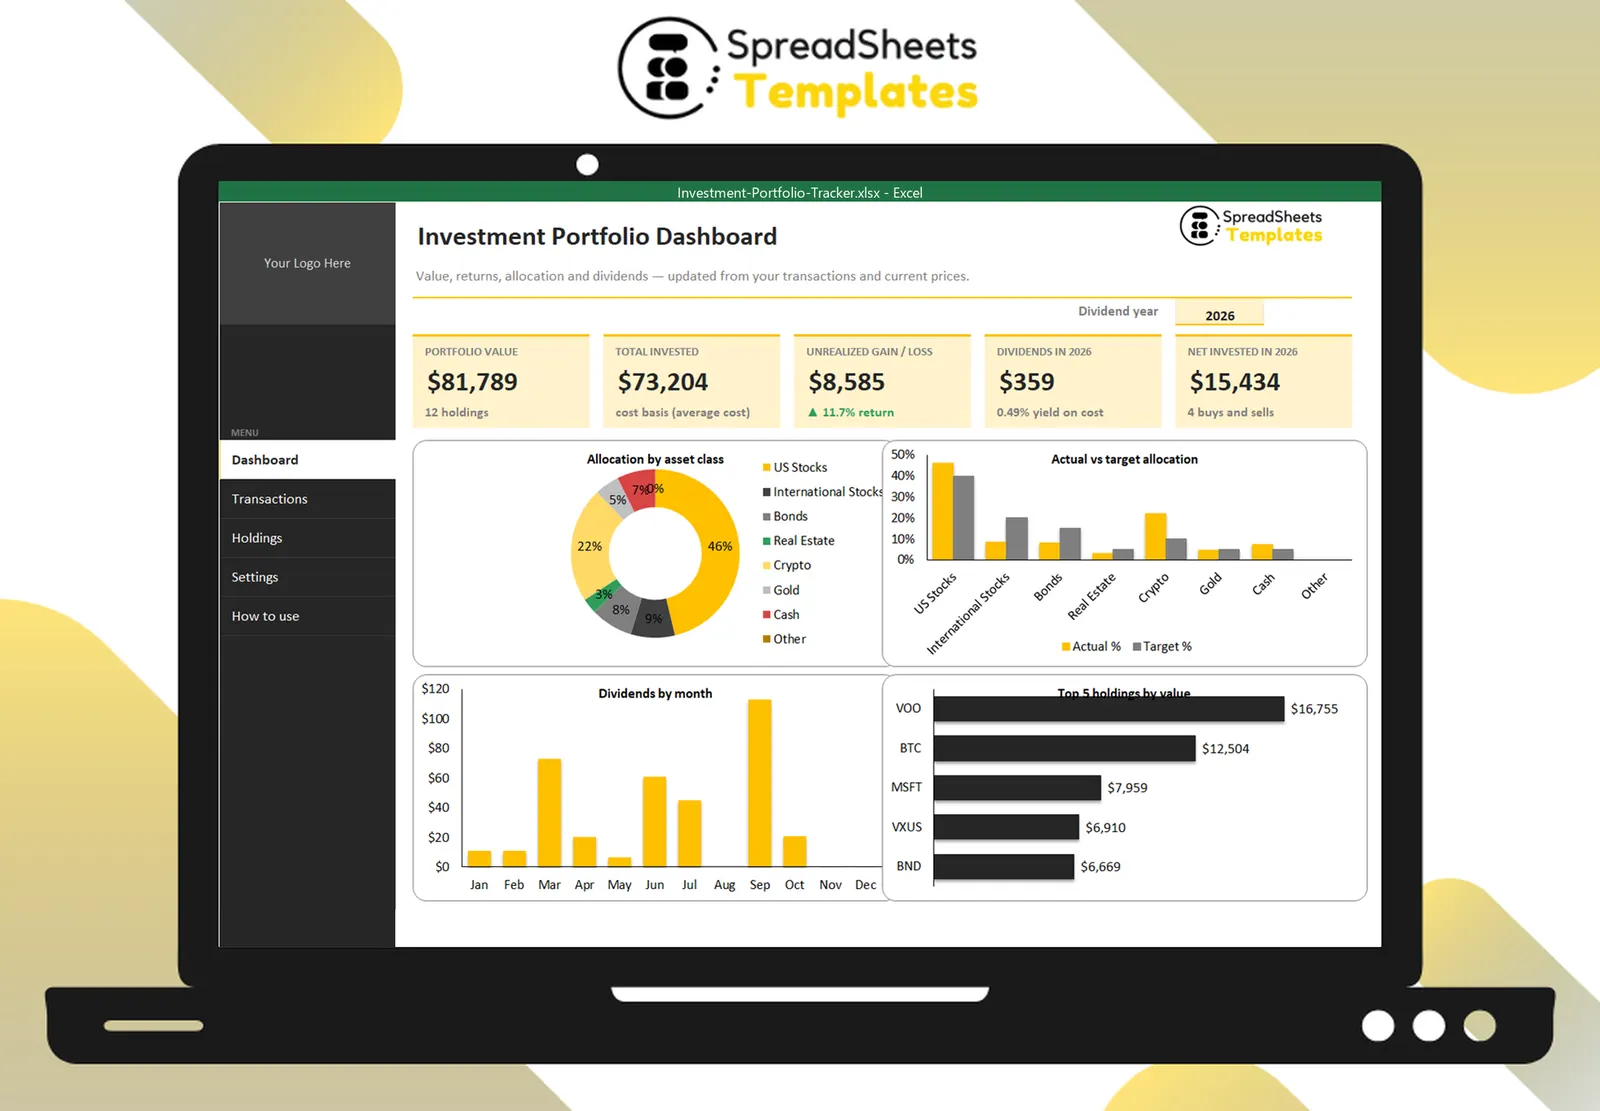
Log your stock, ETF and crypto trades once. The tracker works out shares, average cost, gain/loss and dividends, and shows your allocation against your targets on a clean dashboard.
- ⚡ Instant download
- 🔒 Secure checkout by Stripe
- ↩️ 7-day guarantee
Sound familiar?
- Your investments are spread across a brokerage, an IRA and a crypto wallet
- You don’t know your real return or how much you earned in dividends this year
- Portfolio apps want a subscription and access to your accounts
The Investment Portfolio Tracker fixes that in a few minutes, for $4.99.
What changes when you use it
Everything on one dashboard
Portfolio value, total invested, unrealized gain/loss, dividends in the year and net invested — at a glance.
Allocation vs your targets
Set a target % per asset class and see where you are overweight or underweight.
Dividends month by month
A monthly dividend chart and your yield on cost for any year you pick.
Private and subscription-free
Your data stays in your Excel file. No logins, no bank connections, no monthly fees.
What's inside the spreadsheet
- Dashboard with 5 KPI cards and a year selector
- Allocation by asset class (donut) and actual vs target chart
- Dividends by month and Top 5 holdings charts
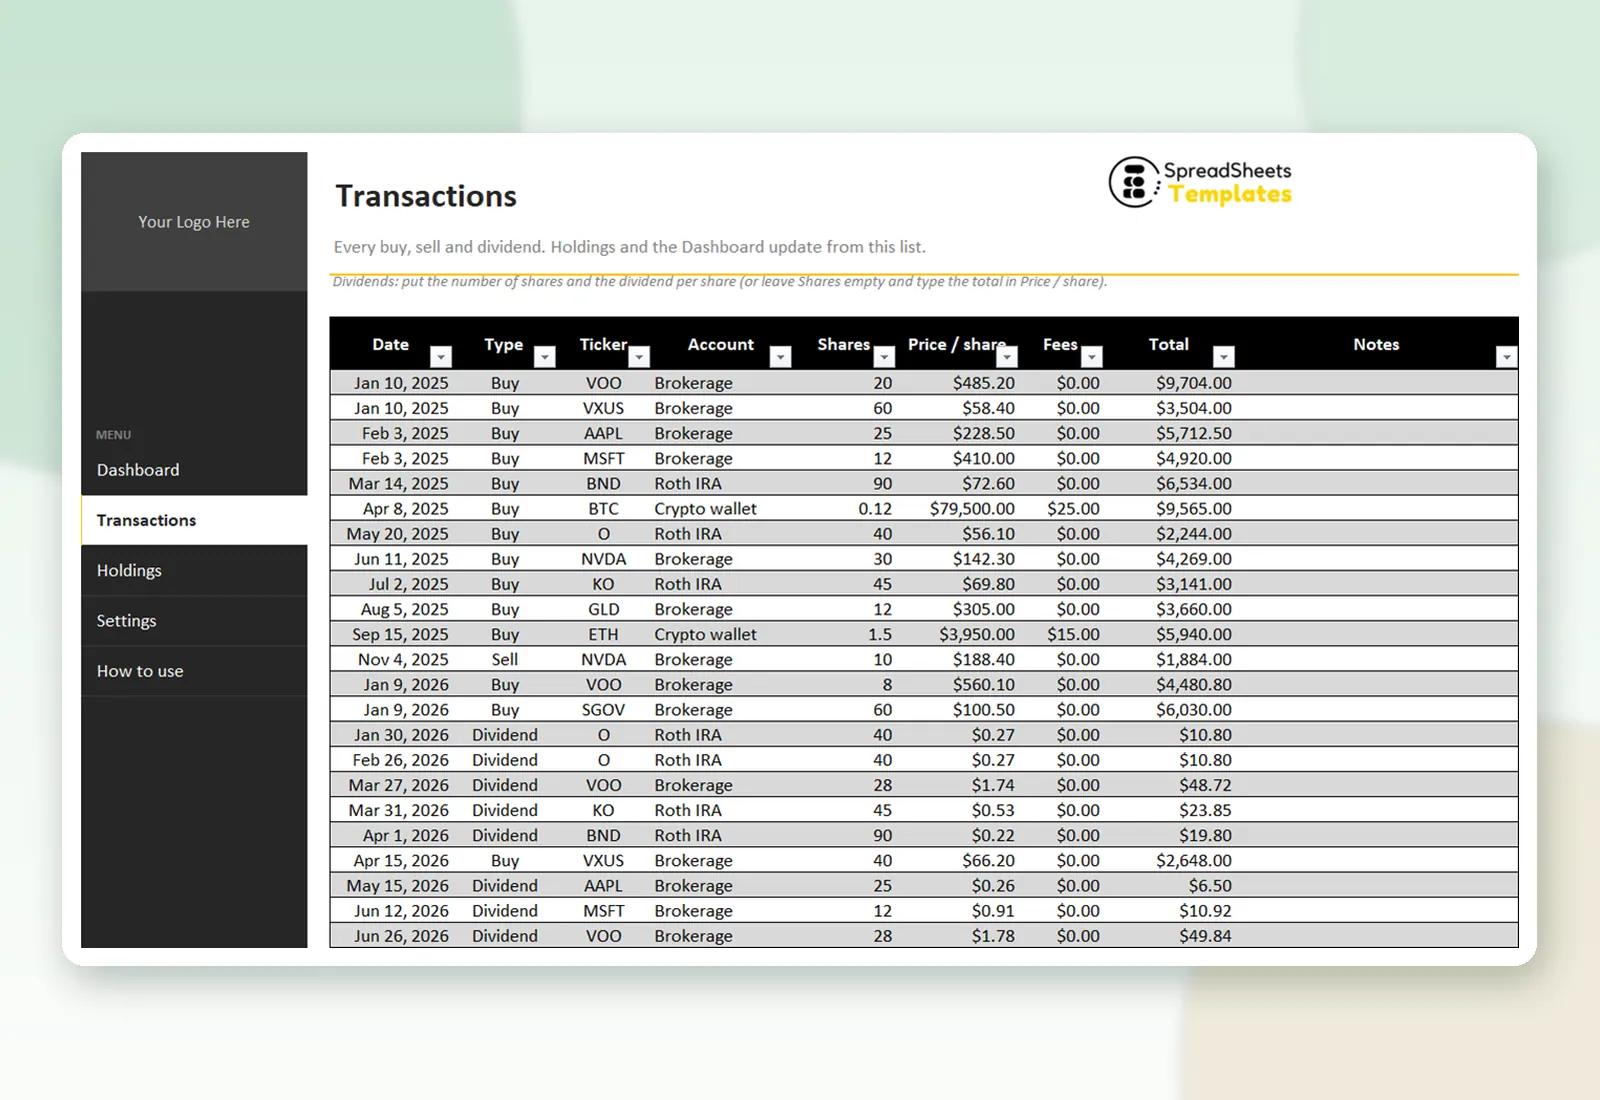
- Transactions log for buys, sells and dividends (500 rows)
- Holdings with shares, average cost, cost basis, market value, gain/loss, return and allocation
- Fractional shares and crypto supported
- Settings for asset classes, targets and accounts
- Dark side menu to jump between tabs
- How to use tab
Ready in 3 simple steps
Buy securely
Pay $4.99 once through the secure checkout (Stripe).
Download instantly
Your file is ready right after payment and also arrives in your e-mail.
Fill in and use
Open it in Excel, type your data and let the formulas do the work.
Made for
Everything you get
- Investment Portfolio Tracker (.xlsx file), 100% editable
- Instant download right after payment, plus the link in your e-mail
- Use it on as many of your own computers as you need
- No subscription and no monthly fees, ever
- Free e-mail support to help you get started
- 7-day money-back guarantee
Works with: Excel 2010 or newer on Windows or Mac · also opens in Google Sheets
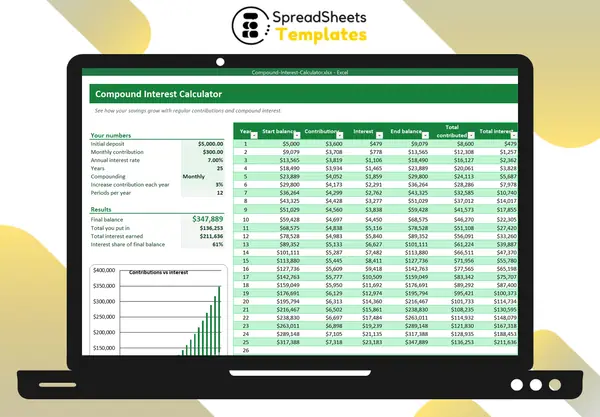 Project how your portfolio can grow with the Compound Interest Calculator.
Investment Portfolio Tracker
$4.99
One payment of $4.99 — less than a single month of most portfolio apps.
Download nowFrequently asked questions
Does it update prices automatically?
You type the current price in the Holdings tab whenever you want a fresh picture. In Excel 365 you can also use the Stocks data type to pull prices.
Can I track crypto and fractional shares?
Yes. Shares accept decimals, so 0.12 BTC or 3.5 shares of an ETF work fine.
How is the cost basis calculated?
With the average cost of your buys (fees included). Selling reduces the number of shares at that average cost.
Is this investment advice?
No. It is a tracking tool: it organizes the numbers you enter.
How do I receive the spreadsheet?
Right after payment you get the download link on screen and by e-mail. Lost it? Get new links anytime on the "My downloads" page.
Which software do I need?
Microsoft Excel 2010 or newer (including Microsoft 365) on Windows or Mac. It also opens in Google Sheets and LibreOffice, although some formatting may look slightly different.
Can I edit it and add my logo?
Yes. The file is not locked: you can rename labels, add rows and put your own logo in it.
What language is the file in?
English.
Is it a subscription?
No. You pay $4.99 once and the file is yours to use for as long as you want.
What if it is not what I need?
You have 7 days to try it. If it does not meet your needs, write to us and we will help you, exchange it for another template or refund your payment.
More about the Investment Portfolio Tracker
Log your stock, ETF and crypto trades once. The tracker works out shares, average cost, gain/loss and dividends, and shows your allocation against your targets on a clean dashboard.
What's inside
- Dashboard with 5 KPI cards and a year selector
- Allocation by asset class (donut) and actual vs target chart
- Dividends by month and Top 5 holdings charts
- Transactions log for buys, sells and dividends (500 rows)
- Holdings with shares, average cost, cost basis, market value, gain/loss, return and allocation
- Fractional shares and crypto supported
- Settings for asset classes, targets and accounts
- Dark side menu to jump between tabs
- How to use tab
Works in Microsoft Excel 2010 or newer (Windows and Mac) and opens in Google Sheets. One-time payment, instant download.
Get organized today for just $4.99
Download the Investment Portfolio Tracker now and start using it in minutes.
Download now for $4.99One-time payment · Instant download · 7-day guarantee