How to Calculate Weighted Grades in Excel
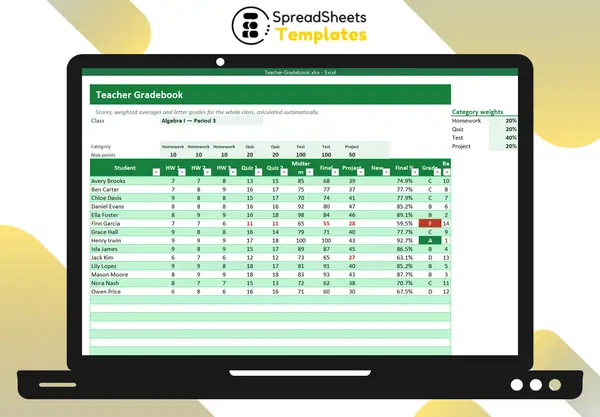
Most courses don’t weight every assignment equally: tests count more than homework. Weighted grades reflect that — and Excel can calculate them automatically.
How category weighting works
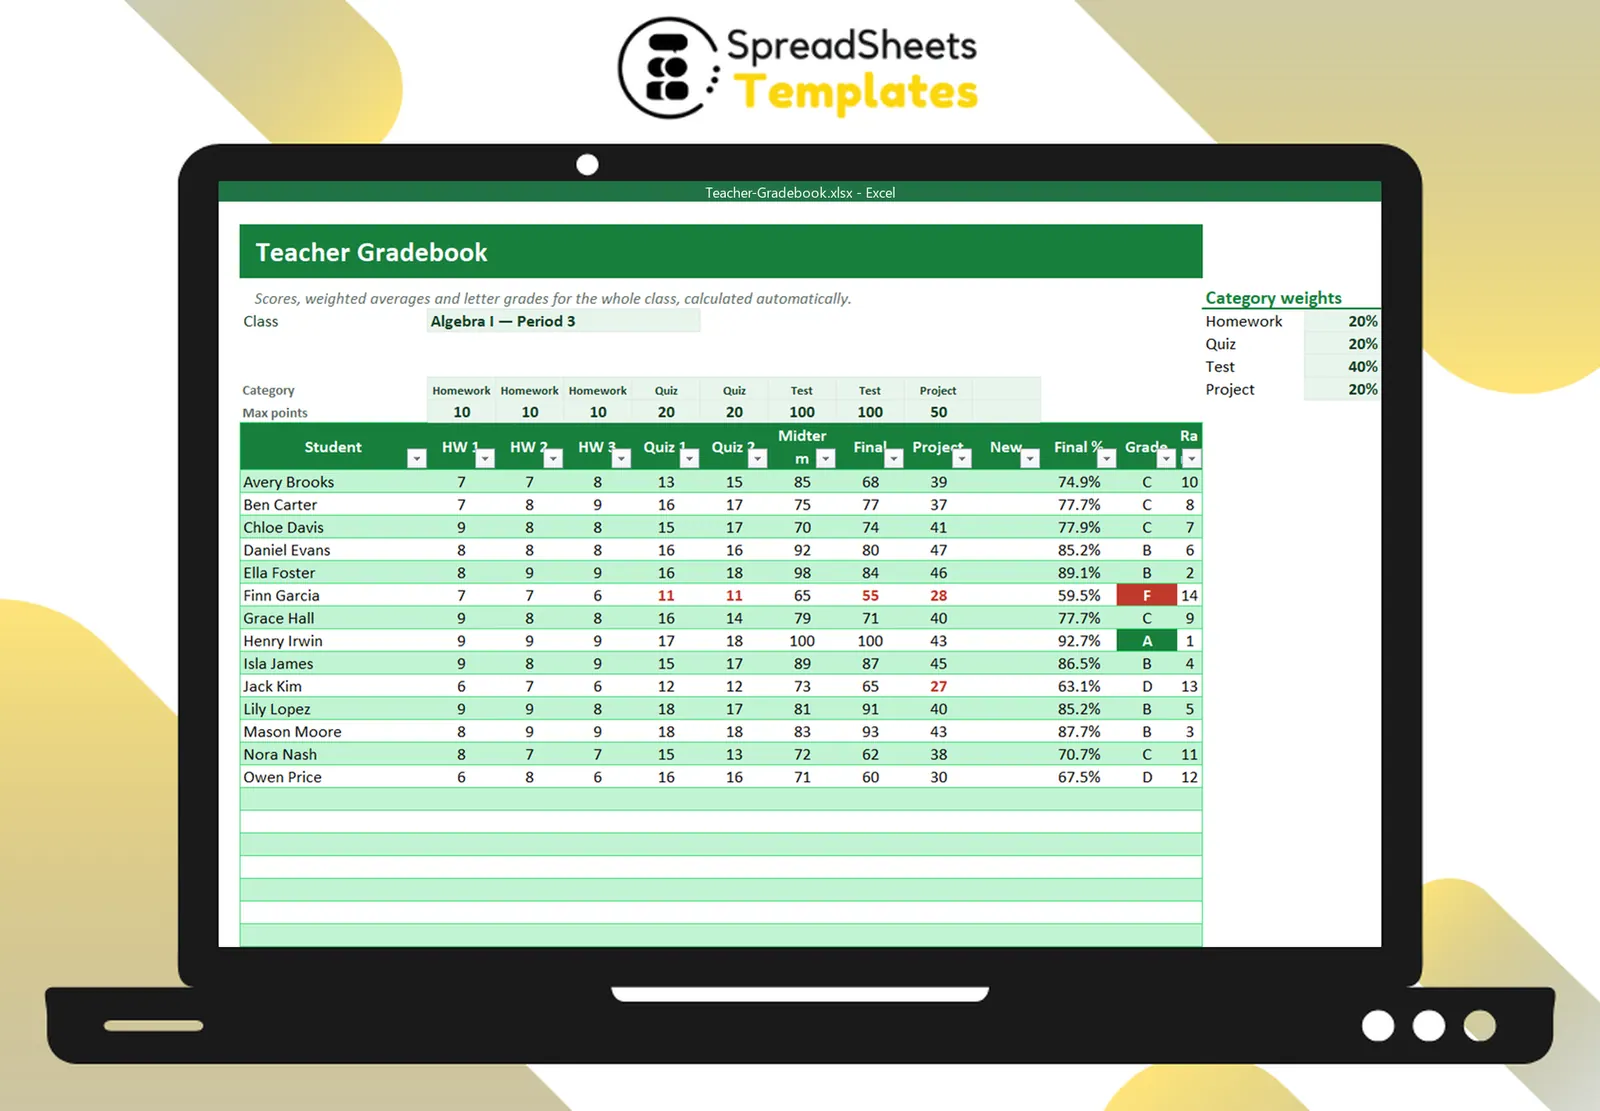
Say your categories are Homework 20%, Quizzes 20%, Tests 40%, Project 20%.
- Within each category, calculate the percentage: points earned ÷ points possible.
- Multiply each category percentage by its weight.
- Add them up.
A student with 80% in homework, 75% in quizzes, 82% in tests and 86% in the project: 0.2×80 + 0.2×75 + 0.4×82 + 0.2×86 = 81%.
Don’t count ungraded work as zero
If a category has no graded work yet, divide by the sum of the weights that do. Empty cells should mean “not graded”, not zero. Type 0 only for missing work that should count.
The Excel formula (per category)
With categories in row 7, max points in row 8 and scores in row 10:
=SUMPRODUCT((C$7:K$7="Test")*ISNUMBER(C10:K10), C10:K10) / SUMPRODUCT((C$7:K$7="Test")*ISNUMBER(C10:K10), C$8:K$8)
Repeat for each category and combine with the weights.
Letter grades
Put the scale in a small table sorted from lowest to highest (0% F, 60% D, 70% C, 80% B, 90% A) and use:
=LOOKUP(FinalPercent, ScaleFrom, ScaleLetter)
Class statistics
AVERAGE, MAX and MIN for each assignment show which ones were too hard (or too easy). A COUNTIF of each letter gives the grade distribution.
Template
The Teacher Gradebook does true category weighting, ignores ungraded work, assigns letter grades from your scale, ranks students and shows class statistics and grade distribution.