How to Create a Risk Register (With a Heat Map)
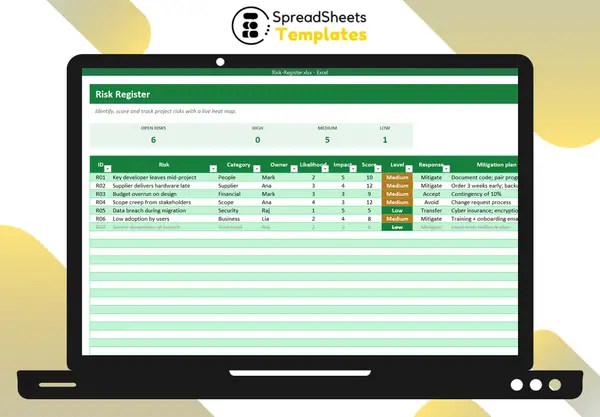
A risk register is a living list of things that could go wrong in a project, how likely and how bad they are, and what you’ll do about them. It turns worries into actions.
Step 1: Identify risks
Brainstorm with the team by category: people, suppliers, budget, scope, technology, security, legal, business. Write each risk as a cause and effect: “Supplier delivers hardware late, delaying installation.”
Step 2: Score likelihood and impact
Use a 1–5 scale for each:
- Likelihood: 1 rare … 5 almost certain
- Impact: 1 negligible … 5 severe
Risk score = likelihood × impact (1 to 25).
Step 3: Classify
- High (15–25): needs an action plan now.
- Medium (8–14): monitor and mitigate.
- Low (1–7): accept and review.
Step 4: Choose a response
- Avoid — change the plan so the risk can’t happen.
- Mitigate — reduce likelihood or impact (backup supplier, testing).
- Transfer — insurance, contracts, outsourcing.
- Accept — keep a contingency and move on.
Every risk needs an owner and a concrete mitigation plan.
Step 5: Visualize with a heat map
A 5×5 grid with likelihood on one axis and impact on the other, colored green, yellow and red, shows where risks concentrate. In Excel, each cell counts open risks with COUNTIFS(Likelihood, 5, Impact, 4, Status, "Open").
Step 6: Review regularly
Go through the register in every project meeting, starting with the red zone. Update scores, close risks that no longer apply, add new ones.
Template
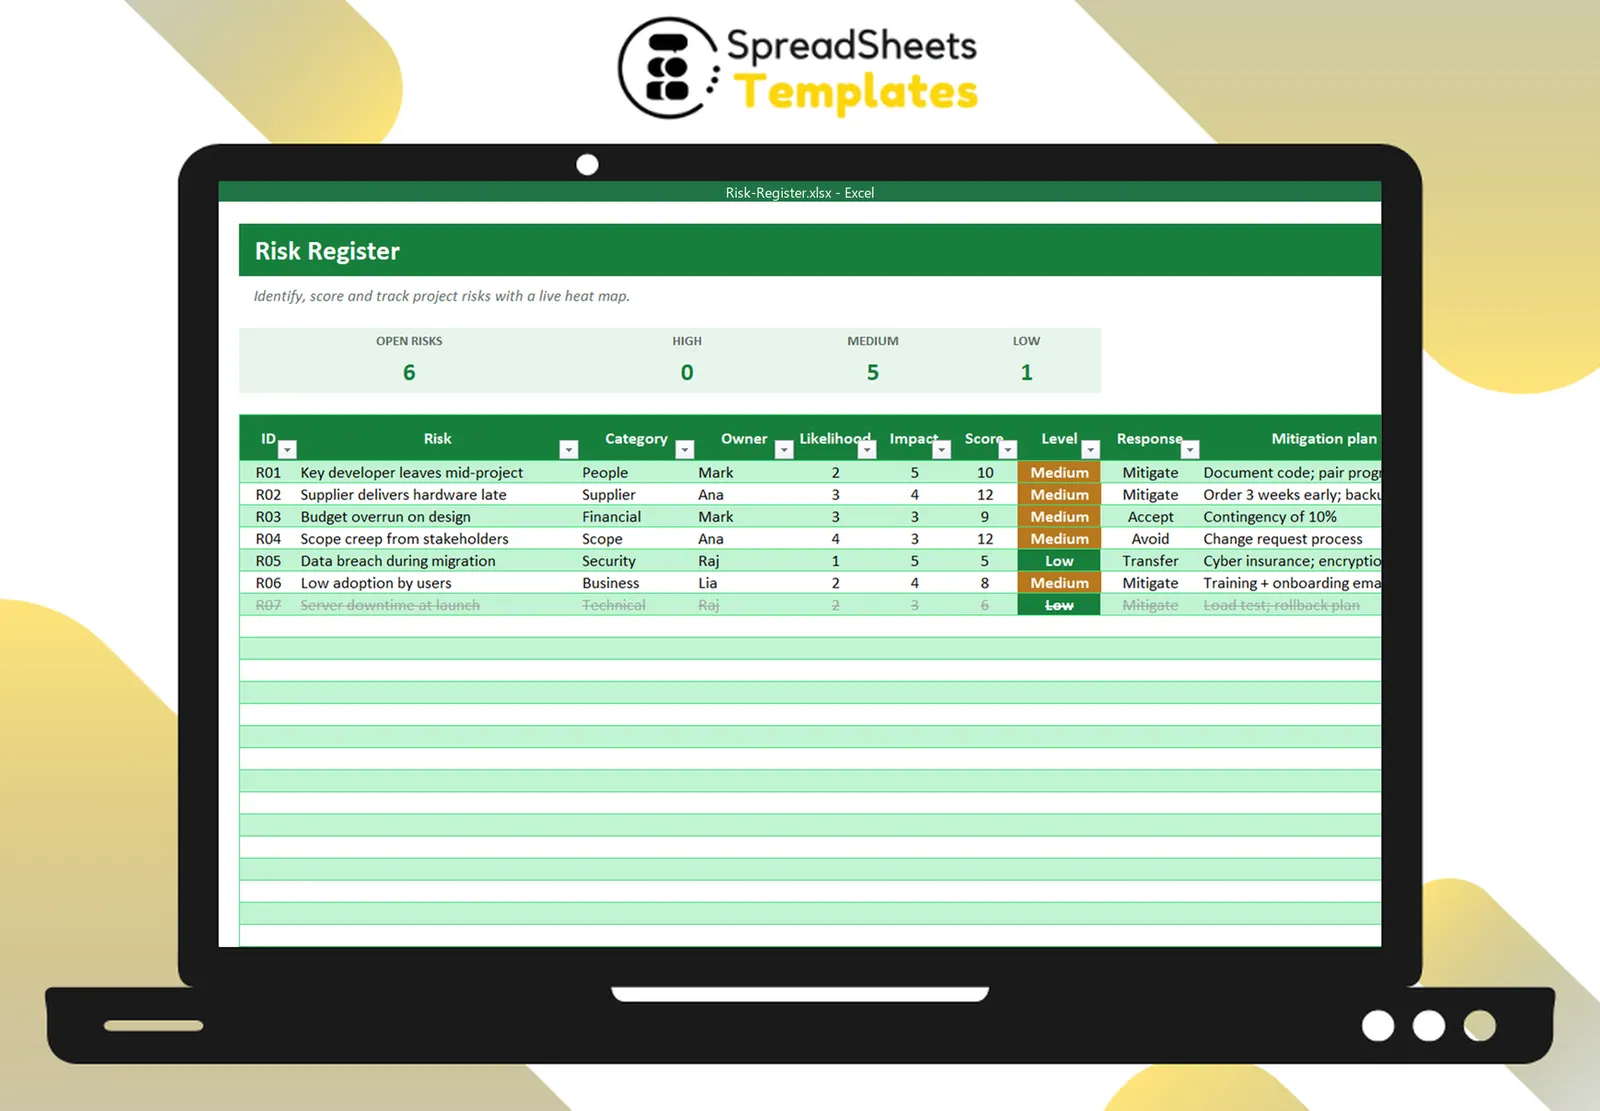
The Risk Register scores each risk automatically, colors the level, tracks response, mitigation, owner and status, and plots open risks on a live 5×5 heat map.