How to Make a Gantt Chart in Excel (Step by Step)
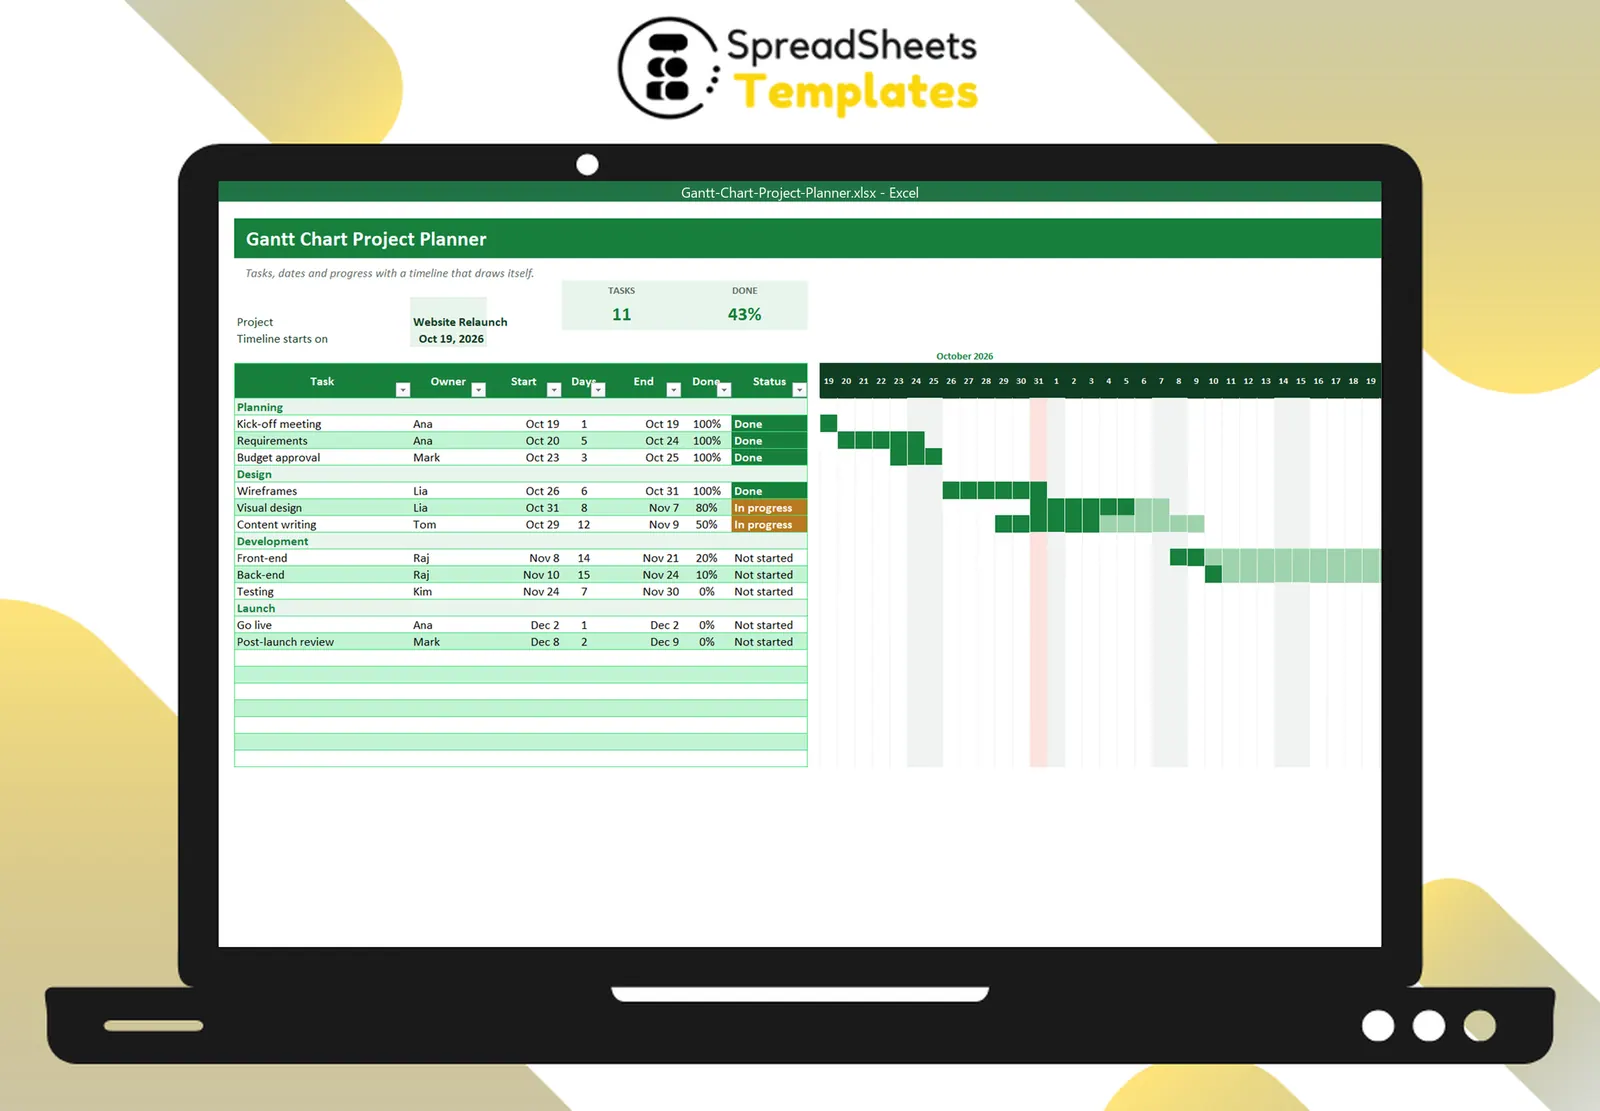
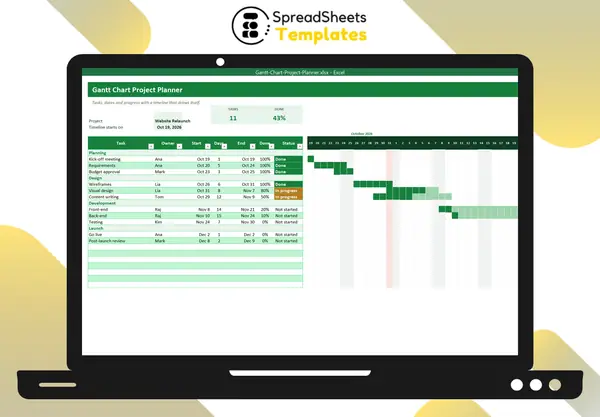
A Gantt chart shows a project as horizontal bars on a timeline: each bar is a task, from its start date to its end date. It’s the fastest way to see what happens when, who is doing it and what is late.
What you need
For each task: name, owner, start date, duration (days) and % complete. The end date is calculated: =Start + Days − 1.
The conditional formatting method
The cleanest Gantt in Excel doesn’t use a chart at all — it uses a grid of cells and conditional formatting:
- Next to the task table, create one narrow column per day, with the date in the header (
=TimelineStart + 0,+1,+2…). - Select the grid and add a rule: fill green when the header date is between the task’s start and end:
=AND(J$8>=$D9, J$8<=$F9) - Add a darker rule for the completed part:
=AND(J$8>=$D9, J$8<=$D9+$E9*$G9-1) - Shade weekends with
=WEEKDAY(J$8,2)>5and highlight today with=J$8=TODAY().
Because the bars are formulas, they move when dates change.
Status automatically
A simple status formula keeps everyone honest:
=IF(G9>=1,"Done",IF(F9<TODAY(),"Late",IF(D9<=TODAY(),"In progress","Not started")))
Tips for a useful Gantt
- Use phases: group tasks under titles (Planning, Design, Development, Launch).
- Keep tasks short: 1–10 days. Long tasks hide delays.
- One owner per task.
- Update % done weekly — a Gantt nobody updates is decoration.
- Mark milestones as 1-day tasks (go live, approvals).
When to use project software instead
If you have hundreds of tasks, complex dependencies or resource leveling, dedicated software is worth it. For most small projects — campaigns, events, launches, renovations — an Excel Gantt is faster and everyone can open it.
Template
The Gantt Chart Project Planner has the task table with automatic end dates and status, phase rows, a 9-week timeline with progress shading, weekends and a today marker. For day-to-day task management, add the Project Task Tracker.