How to Track Your Investment Portfolio in Excel (Step by Step)
If your investments live in more than one place — a brokerage account, an IRA, a crypto wallet — it is hard to answer simple questions: How much is my portfolio worth? Am I up or down? How much did I earn in dividends this year? A spreadsheet answers all of them, privately and without a subscription.
What a good portfolio tracker needs
- A transactions log — every buy, sell and dividend, with date, ticker, shares, price and fees.
- A holdings view — one row per ticker with shares owned, average cost, current price and market value.
- Returns — unrealized gain/loss in dollars and percent.
- Dividends — by month and by year, plus your yield on cost.
- Allocation — how your money is split across asset classes, compared with your targets.
Step 1: log every transaction
Use one row per event:
| Date | Type | Ticker | Shares | Price | Fees |
|---|---|---|---|---|---|
| Jan 10, 2025 | Buy | VOO | 20 | $485.20 | $0 |
| Nov 4, 2025 | Sell | NVDA | 10 | $188.40 | $0 |
| Mar 27, 2026 | Dividend | VOO | 28 | $1.74 | $0 |
The total of a buy is shares × price + fees; for a sale it is shares × price − fees. For a dividend, multiply shares by the dividend per share.
Step 2: calculate shares and average cost
With the log in place, each holding comes from SUMIFS:
- Shares owned = shares bought − shares sold:
=SUMIFS(Shares,Ticker,"VOO",Type,"Buy")-SUMIFS(Shares,Ticker,"VOO",Type,"Sell") - Average cost = total paid on buys ÷ shares bought.
- Cost basis = shares owned × average cost.
Step 3: market value and gain/loss
Type the current price of each ticker. Then:
- Market value = shares × current price
- Gain/loss = market value − cost basis
- Return = gain/loss ÷ cost basis
Update prices weekly or monthly — you don’t need live quotes to make good decisions. (In Excel 365, the Stocks data type can fill prices for you.)
Step 4: track dividends
Sum dividends by month for the year you are looking at:
=SUMIFS(Total,Type,"Dividend",Date,">="&DATE(2026,3,1),Date,"<"&DATE(2026,4,1))
Yield on cost = dividends in the year ÷ total invested. It shows what your money is paying you, based on what you actually paid.
Step 5: compare allocation with targets
Decide a target mix — for example 40% US stocks, 20% international, 15% bonds, 10% crypto. Sum market value by asset class and divide by the total. When an asset class drifts far above its target, that is your signal to rebalance by adding money to what is underweight.
Put it on a dashboard
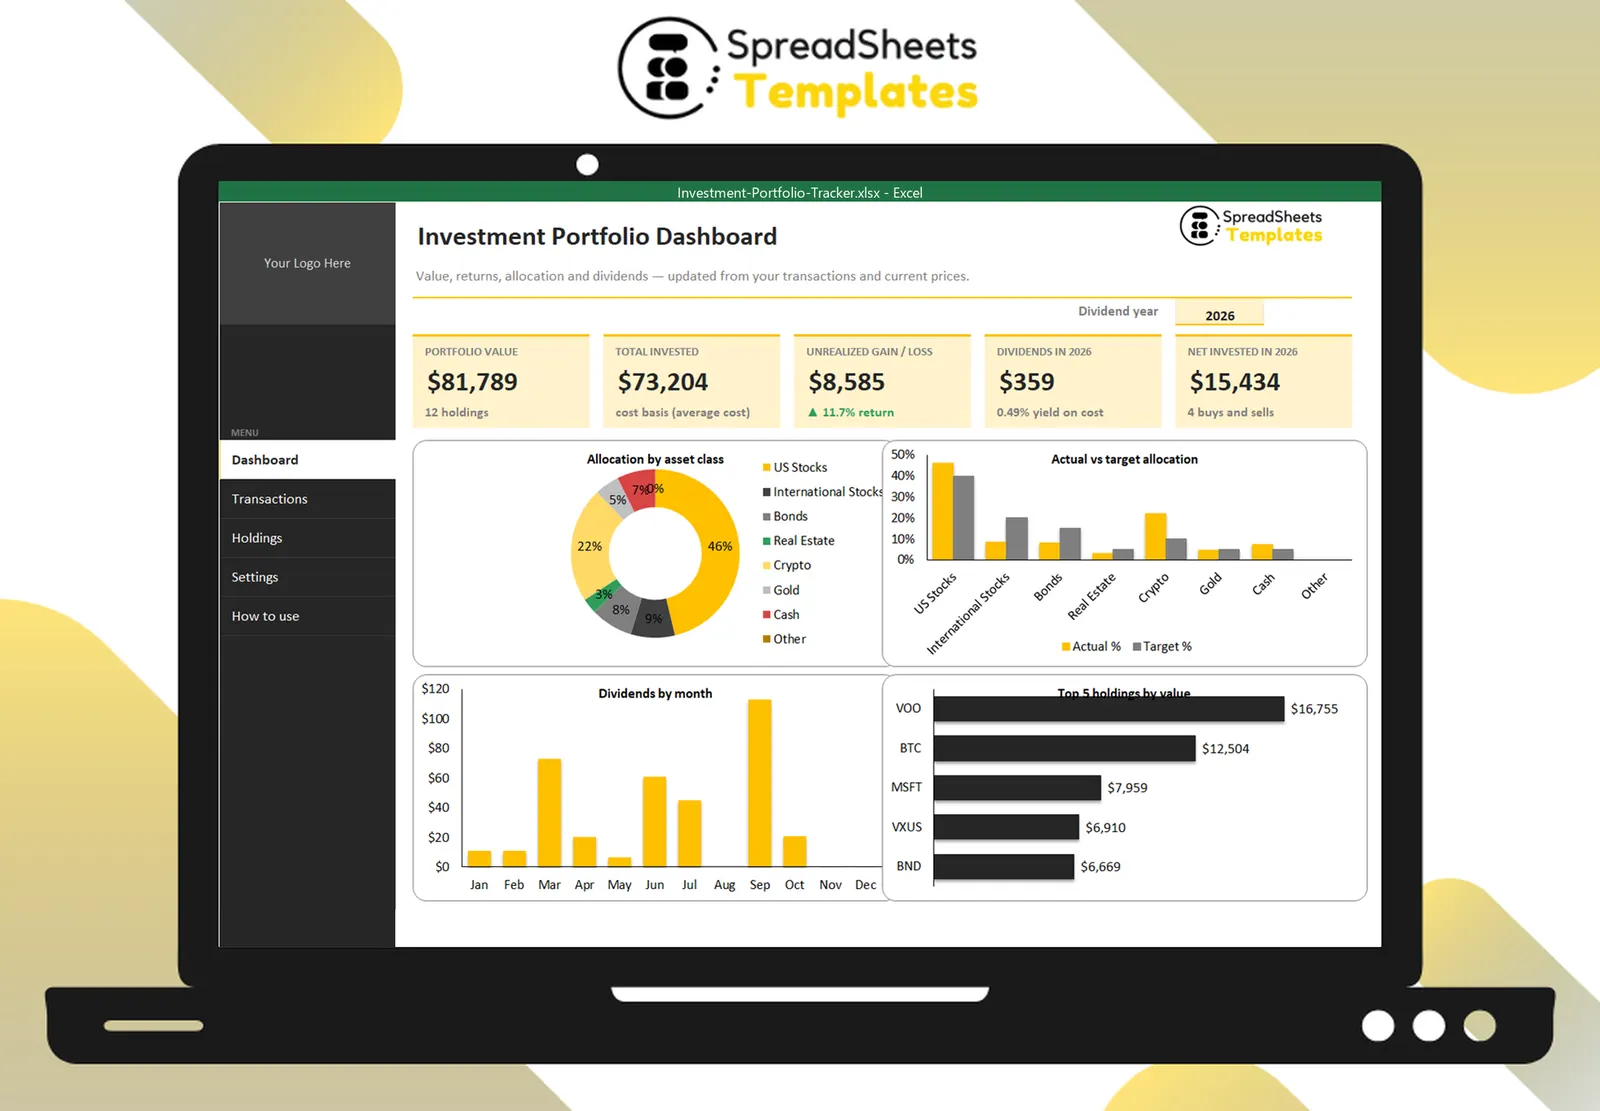
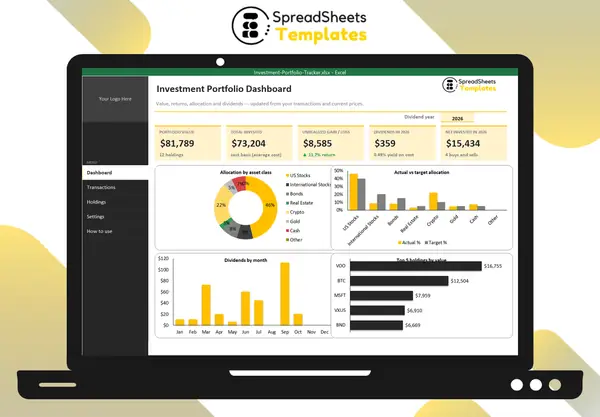
Numbers in tables are fine; a dashboard is better. Five indicators — portfolio value, total invested, gain/loss, dividends in the year and net invested — plus four charts (allocation, actual vs target, dividends by month, top holdings) tell the story in seconds.
Template
The Investment Portfolio Tracker does all of this for you: a transactions log, automatic holdings with average cost and returns, dividends by month, allocation vs targets and a dashboard with a year selector — with a dark side menu to move between tabs. Stocks, ETFs, crypto and fractional shares all work. It is a tracking tool, not investment advice.