How to Calculate Your Break-Even Point (Formula + Example)
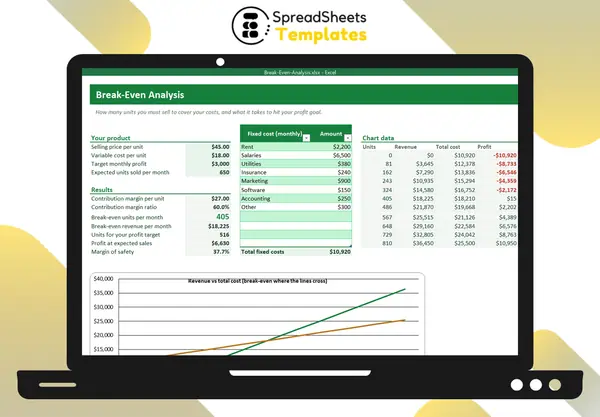
The break-even point is the sales level where revenue exactly covers all costs: no profit, no loss. Below it you lose money; above it every sale contributes to profit. It is the most useful number for pricing and setting sales goals.
The two kinds of cost
- Fixed costs don’t change with sales: rent, salaries, insurance, software, accounting.
- Variable costs grow with each unit sold: materials, packaging, shipping, payment fees, commissions.
Contribution margin
Each unit sold “contributes” its price minus its variable cost to pay the fixed costs:
Contribution margin per unit = price − variable cost
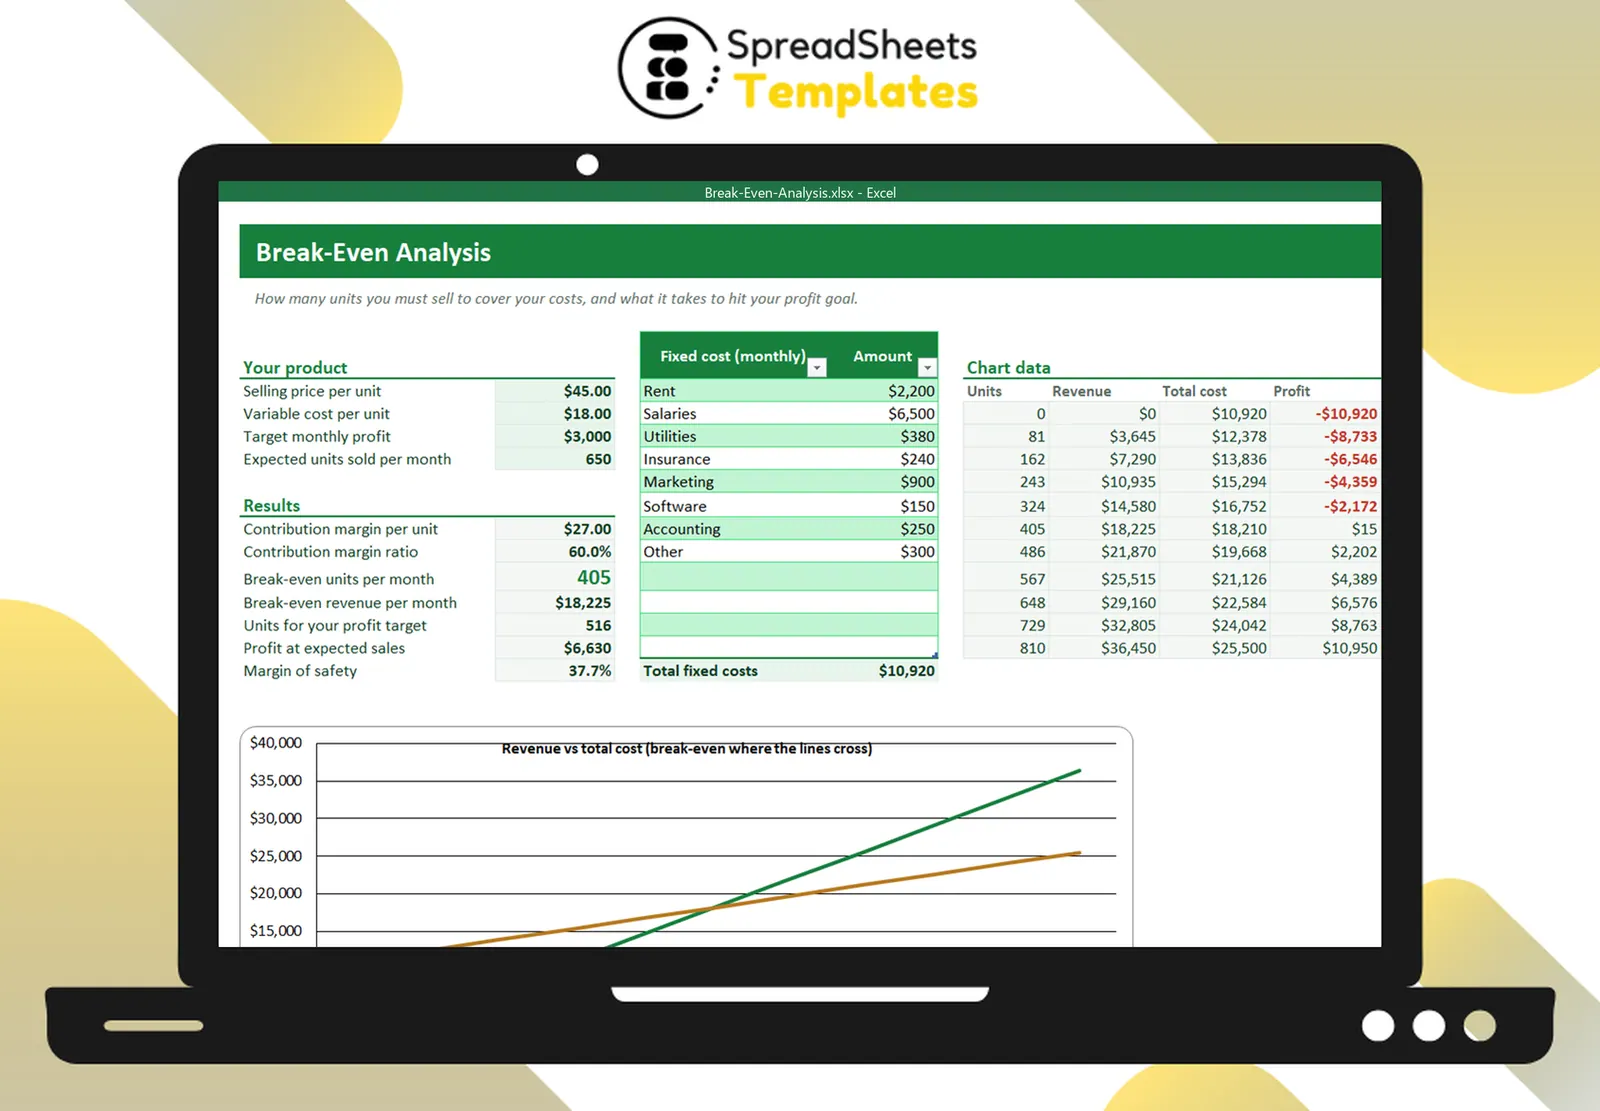
If you sell at $45 and each unit costs $18 to make, every sale contributes $27.
The break-even formula
Break-even units = fixed costs ÷ contribution margin per unit
With $10,920 of monthly fixed costs: $10,920 ÷ $27 = 405 units a month (round up). Break-even revenue = 405 × $45 ≈ $18,225.
Units for a profit target
Add the profit you want to the fixed costs:
Units = (fixed costs + target profit) ÷ contribution margin
For $3,000 of monthly profit: ($10,920 + $3,000) ÷ $27 = 516 units.
Margin of safety
How far your expected sales are above break-even:
Margin of safety = (expected sales − break-even sales) ÷ expected sales
Expecting 650 units: (650 − 405) ÷ 650 ≈ 38%. Sales could drop 38% before you start losing money.
What moves the break-even point
- Raising the price increases the contribution margin — often the most powerful lever.
- Cutting variable costs (better supplier, cheaper packaging) does the same.
- Cutting fixed costs helps, but small savings move the point less than people think.
In Excel
Break-even units: =ROUNDUP(FixedCosts/(Price-VariableCost),0). A small table of units from 0 to twice the break-even, with revenue and total cost columns, gives you the classic chart where the lines cross.
Template
The Break-Even Analysis has price and variable cost inputs, a fixed cost list, contribution margin, break-even units and revenue, units for your profit target, margin of safety and the revenue vs cost chart. To price each product, use the Pricing & Profit Margin Calculator.