How to Calculate Food Cost and Price Your Menu
In food businesses, small pricing mistakes multiply with every plate. Recipe costing tells you exactly what a dish costs to make, so you can price it to cover food, labor, rent — and profit.
Step 1: Build an ingredient price list
For each ingredient you buy, record the purchase unit (g, ml, unit), the pack size and the pack price. The cost per unit is:
pack price ÷ pack size
A 1,000 g bag of chicken breast at $9.80 costs $0.0098 per gram.
Step 2: Cost the recipe
List every ingredient and the quantity used, then multiply by the cost per unit. Don’t forget the small things: oil, salt, garnish. They add up across hundreds of plates.
Recipe cost = Σ (quantity × cost per unit) Cost per serving = recipe cost ÷ servings
Step 3: Food cost percentage
Food cost % = cost per serving ÷ menu price
Most restaurants aim for 28–35%. Fine dining may run higher, pizza and pasta often lower.
Step 4: Set the price
To hit a target food cost:
Menu price = cost per serving ÷ target food cost %
Example: a pasta dish costs $3.95 per serving; target 30% → $3.95 ÷ 0.30 = $13.17. Then round to a menu-friendly price and check against the market.
Step 5: Keep prices updated
Ingredient prices change constantly. Updating the price list monthly — and having recipes recalculate automatically — prevents margins from shrinking silently.
Beyond food cost
Food cost is only part of the picture. Labor, rent, utilities and waste matter too. Many operators track prime cost (food + labor) and aim for under 60–65% of sales.
Tips
- Weigh portions; inconsistent portions destroy food cost.
- Account for yield (trimming, cooking loss) in quantities.
- Engineer the menu: promote high-margin dishes.
Template
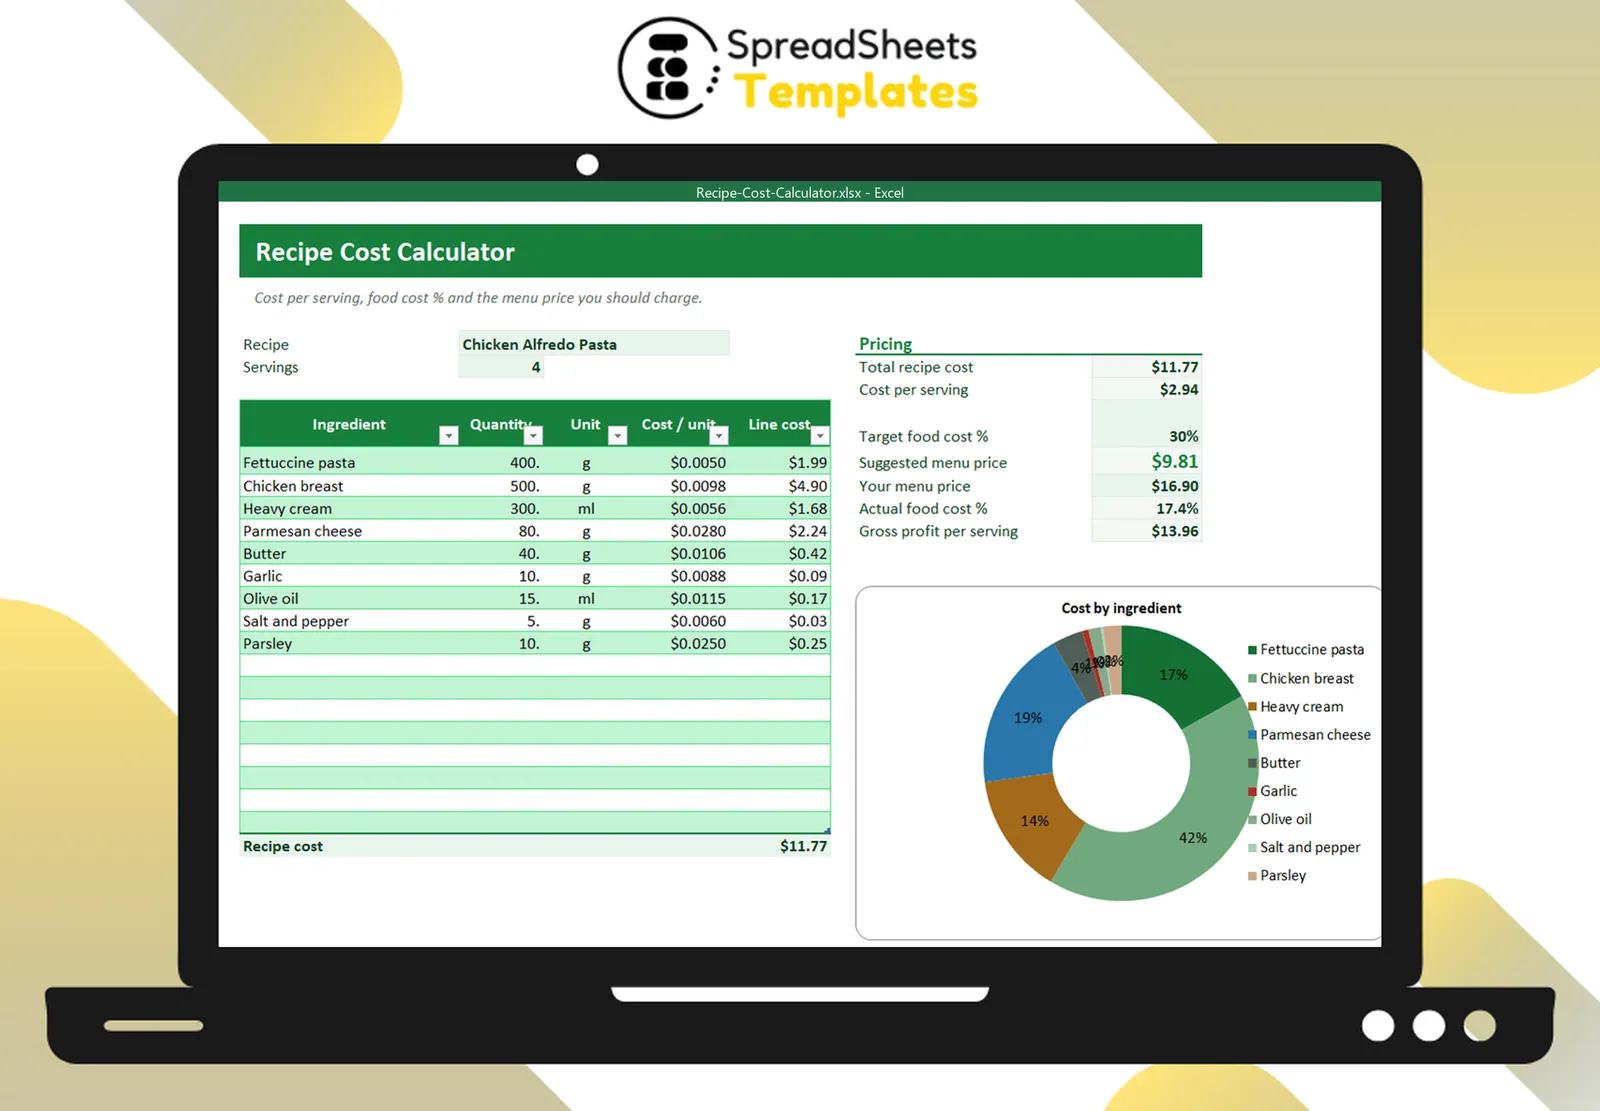
The Recipe Cost Calculator includes an ingredient price list with cost per unit, a recipe sheet with drop-down ingredients, cost per serving, suggested menu price for your target food cost, actual food cost % and a cost-by-ingredient chart.