Fleet Management Spreadsheet in Excel: The Complete Guide

If you run between 3 and 100 vehicles, a well-built fleet management spreadsheet gives you most of what expensive fleet software does: cost per vehicle, fuel efficiency, maintenance due dates and driver performance. The difference is that you pay once and keep full control of your data.
This guide shows what to track, how to organize the workbook and which formulas turn raw records into decisions.
What a fleet spreadsheet must answer
Before building tabs, decide which questions the file must answer every month. For most small fleets they are:
- How much does each vehicle cost per mile (or km)?
- Which vehicles or drivers consume more fuel than they should?
- What maintenance is due, and what was done last?
- Which trips or customers are profitable?
- When should a vehicle be replaced?
Every tab and column you create should feed one of these answers. If a field doesn’t, it is noise.
The tabs you need
A practical fleet workbook has registration tabs (data that rarely changes), log tabs (one row per event) and report tabs (formulas only).
| Tab | Type | Main fields |
|---|---|---|
| Vehicles | Registration | Plate, model, year, type, acquisition date, odometer at purchase |
| Drivers | Registration | Name, license number, license expiry, phone |
| Suppliers & fuel stations | Registration | Name, type of service, contact |
| Trips | Log | Date, vehicle, driver, origin, destination, load, start and end odometer |
| Fueling | Log | Date, vehicle, odometer, liters or gallons, price, total paid, station |
| Maintenance | Log | Date, vehicle, odometer, type (preventive/corrective), service, parts, cost |
| Tires | Log | Tire ID, vehicle, position, install date and odometer, removal, reason |
| Expenses | Log | Date, vehicle, category (tolls, fines, insurance, parking), amount |
| Dashboard | Report | KPIs per vehicle, driver and month |
Tip: use drop-down lists (Data › Data Validation) in every log tab, pulling plates and driver names from the registration tabs. It eliminates typos like “ABC-1234” vs “ABC1234”, which silently break every report.
The formulas that matter
Distance per trip
= End odometer − Start odometer
Fuel efficiency (km per liter or miles per gallon)
Calculate it between two full-tank fill-ups, not per fill-up:
= (Odometer now − Odometer at previous fill-up) / Liters added now
In Excel you can find the previous odometer for the same vehicle with:
=MAXIFS(Fueling[Odometer], Fueling[Vehicle], [@Vehicle], Fueling[Odometer], "<"&[@Odometer])
Cost per km (or mile) per vehicle
= (Fuel + Maintenance + Tires + Other expenses) / Distance driven in the period
Use SUMIFS to add each cost for one vehicle and one month:
=SUMIFS(Maintenance[Cost], Maintenance[Vehicle], $A2, Maintenance[Date], ">="&$B$1, Maintenance[Date], "<="&$C$1)
Next preventive maintenance
= Odometer at last service + Service interval (e.g. 10,000 km)
Then flag it with conditional formatting when the current odometer is within 10% of that number.
The KPIs worth putting on the dashboard
- Cost per km/mile per vehicle and for the fleet
- Fuel efficiency per vehicle and per driver (with the fleet average for comparison)
- Maintenance cost split into preventive and corrective (a growing corrective share means preventive maintenance is being skipped)
- Distance per vehicle per month (idle vehicles are capital you’re paying for)
- Expenses by category: fuel, tolls, fines, tires, maintenance
We explain how to calculate and read each one in Fleet KPIs: the metrics to track in an Excel dashboard.
Common mistakes that make fleet spreadsheets useless
- Not recording the odometer on fuel and maintenance entries. Without it, you can’t calculate efficiency or service intervals.
- Free-text vehicle names. Always use a drop-down from the vehicle register.
- Mixing partial and full fill-ups when calculating efficiency. Calculate only between full tanks.
- One giant tab for everything. Keep registrations, logs and reports separate.
- Updating once a month from receipts. Log daily, or at least weekly; memory loses data.
When a spreadsheet is enough (and when it isn’t)
A spreadsheet works well when one or two people update it and the fleet has up to roughly 100 vehicles. You need fleet software when you want real-time GPS tracking, telematics data imported automatically, or dozens of people updating records at the same time. For a detailed comparison, read Fleet management software vs. spreadsheet.
Build it yourself or start from a template?
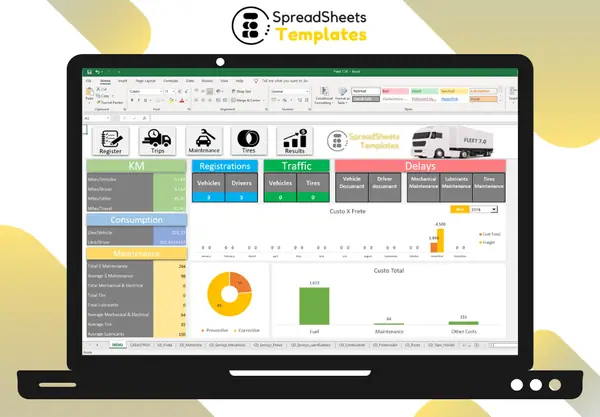
Building the workbook above from scratch takes many hours of formulas, validation lists and dashboard work. If you’d rather start using it today, our Fleet Control Worksheet 7.0 already includes vehicle, driver and supplier registrations, trip and cargo control, fueling, tire and maintenance control, and initial dashboards with km per vehicle, km per liter, average consumption per vehicle and driver, and maintenance cost averages.
For smaller operations that only need to know the real cost of each trip, the Transporter Spreadsheet logs trips, fuel, tolls and fixed expenses and calculates the cost per mile automatically.
FAQ
Can I manage a fleet in Google Sheets instead of Excel? Simple log-based sheets work in Google Sheets. Workbooks with macros (VBA) or advanced dashboards need Microsoft Excel for Windows.
How often should I update the fleet spreadsheet? Fueling and trips should be logged daily. Reports can be reviewed weekly or monthly.
What is a good cost per km for a small fleet? It depends on vehicle type, fuel prices and age of the fleet. More useful than a market benchmark is your own trend: compare each vehicle against the fleet average and against its own previous months.
Should I track tires separately? Yes, for trucks and vans. Tires are one of the largest costs after fuel, and tracking each tire’s install and removal odometer shows which brands and positions really last longer. See how to keep a vehicle maintenance log.