Fleet KPIs: 10 Metrics to Track in an Excel Dashboard
A fleet dashboard is only useful if it shows a handful of numbers that lead to decisions. These are the 10 fleet KPIs worth tracking, with the Excel formula for each and what to do when they go the wrong way.
1. Cost per km (or mile)
Formula: total operating cost ÷ distance driven Why: it’s the single number that summarizes efficiency. Compare each vehicle with the fleet average every month. Action: investigate any vehicle more than 15–20% above the average.
2. Fuel efficiency (km/l or MPG)
Formula: distance between full tanks ÷ fuel added Why: fuel is the largest variable cost. A falling trend signals mechanical problems or driving habits. Action: check tires, filters and injectors; compare drivers on the same model. See the fuel consumption tracking guide.
3. Fuel cost per km
Formula: fuel spend ÷ distance Why: combines efficiency and price paid, so it also reveals expensive fuel stations.
4. Maintenance cost per km
Formula: maintenance spend ÷ distance Why: rises as vehicles age. When it keeps climbing year after year, replacement is usually cheaper than repair.
5. Preventive vs. corrective maintenance ratio
Formula: preventive maintenance cost ÷ total maintenance cost Why: fleets that invest in preventive maintenance spend less overall. A low preventive share means you’re paying for breakdowns. Action: set up service alerts as explained in the vehicle maintenance log guide.
6. Vehicle utilization
Formula: km driven in the period ÷ km a vehicle is expected to drive (or days used ÷ working days) Why: an idle vehicle still costs insurance, depreciation and financing. Action: reassign routes or sell under-used vehicles.
7. Distance per driver
Formula: SUMIFS(Trips[Distance], Trips[Driver], [@Driver])
Why: balances workload and supports fair performance reviews.
8. Cost per trip (or per delivery)
Formula: (fuel + tolls + per diem + other trip costs) ÷ number of trips Why: connects the fleet to revenue. If a customer’s trips cost more than they pay, you need to renegotiate.
9. Fines and incidents per driver
Formula: COUNTIFS(Expenses[Category], "Fine", Expenses[Driver], [@Driver])
Why: fines are pure waste and a strong predictor of accidents.
10. Downtime
Formula: days in the workshop ÷ days in the period Why: every day off the road is lost capacity. Long or frequent downtime points to poor maintenance planning or the wrong workshop.
Building the dashboard in Excel
- Keep raw data in log tables (trips, fueling, maintenance, expenses), formatted as Excel Tables.
- Create a Dashboard tab with a period selector (start and end date) and, optionally, a vehicle selector.
- Calculate each KPI with
SUMIFS,AVERAGEIFSandCOUNTIFSusing the selected period. - Add three or four charts at most: cost per km by vehicle, fuel efficiency trend, maintenance by type and expenses by category.
- Use conditional formatting to flag values outside your targets.
Resist the urge to put 30 charts on the dashboard; if a number doesn’t change a decision, leave it out.
A dashboard that’s already built
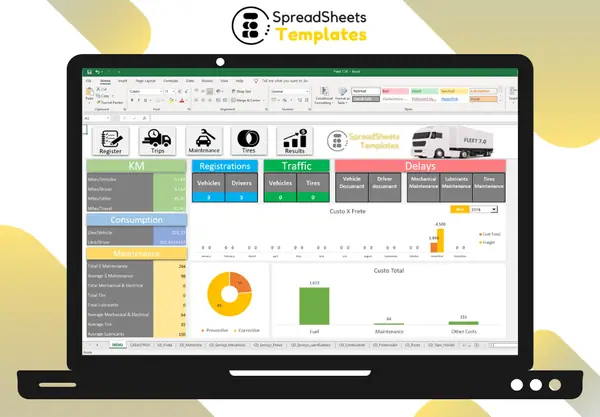
The Fleet Control Worksheet 7.0 comes with initial dashboards for km by driver, km per vehicle, km per liter, km per trip, average consumption per vehicle and per driver, preventive and corrective maintenance totals and maintenance cost averages, plus analysis by year, plate and driver. For the full structure of a fleet workbook, read the fleet management spreadsheet guide.
FAQ
How many KPIs should a small fleet track? Start with cost per km, fuel efficiency and preventive vs. corrective maintenance. Add others as your data becomes reliable.
How often should I review fleet KPIs? Monthly for costs and trends, weekly for fuel efficiency and maintenance alerts.
Do I need telematics to calculate these KPIs? No. Odometer readings, fuel receipts and maintenance invoices are enough for all ten.