How to Build a KPI Dashboard in Excel
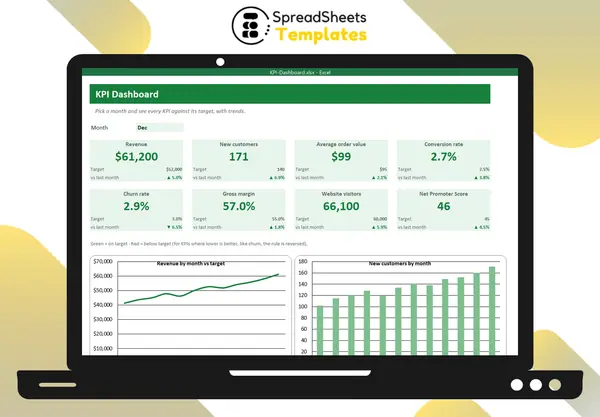
Choose the right KPIs, structure the data, build KPI cards with targets and month selection, and keep the dashboard useful.
Choose the right KPIs, structure the data, build KPI cards with targets and month selection, and keep the dashboard useful.
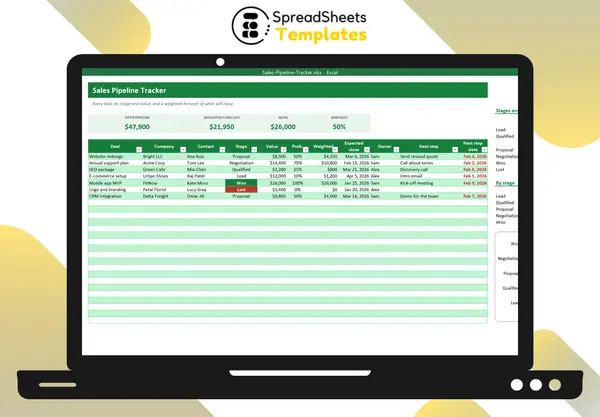
Define pipeline stages, assign probabilities, calculate a weighted forecast and keep a next step on every deal.
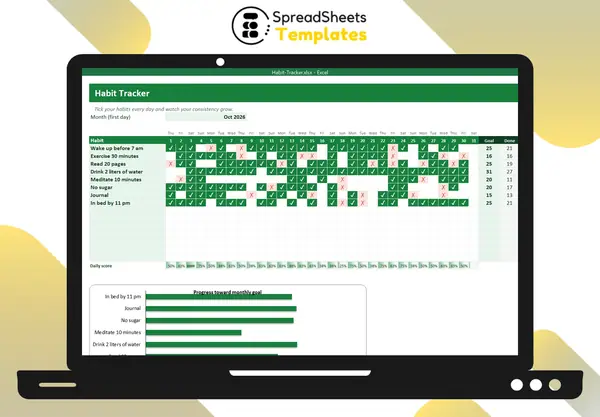
Practical steps to build new habits: start small, set a monthly goal, track daily and never miss twice — with a simple tracker.
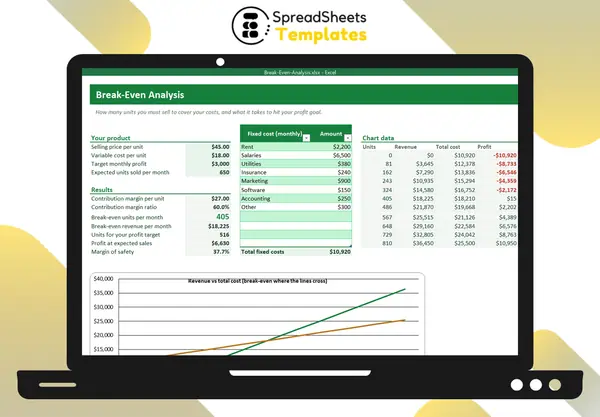
The break-even formula explained with an example: contribution margin, break-even units and revenue, profit targets and margin of safety.
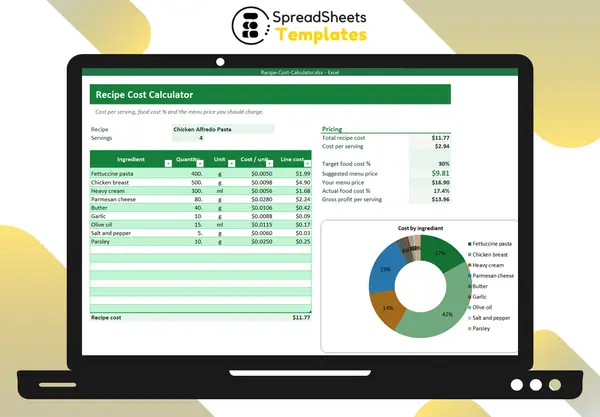
How to cost a recipe, calculate cost per serving and food cost percentage, and set menu prices that protect your margin.
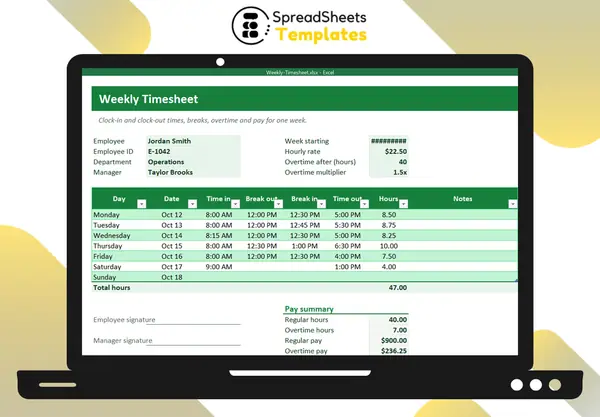
Calculate daily hours with breaks, convert time to decimal hours, and split regular and overtime pay in an Excel timesheet.
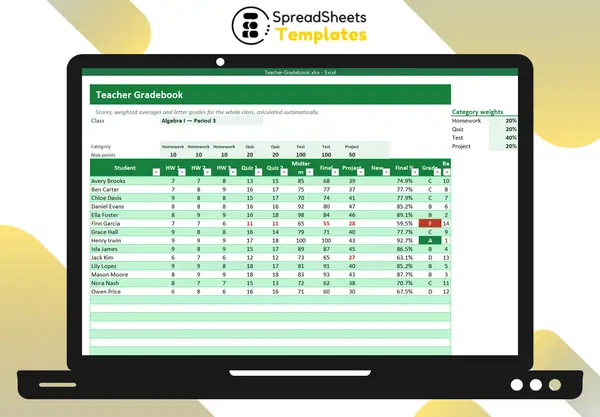
How weighted grading works by category, the Excel formulas for weighted averages, letter grades with LOOKUP and class statistics.
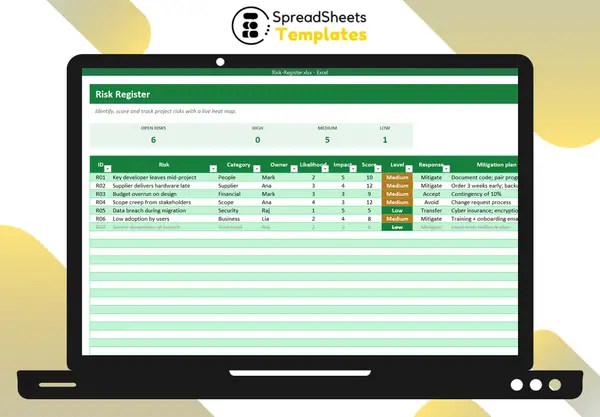
Identify risks, score likelihood and impact, choose responses and visualize them on a heat map — a practical guide.
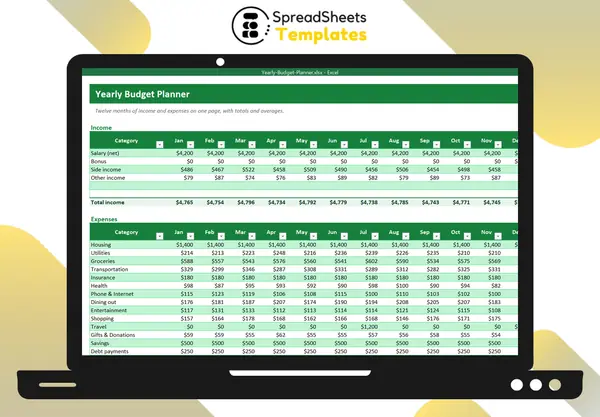
How to plan a yearly budget month by month, account for irregular expenses and track your cumulative savings in Excel.
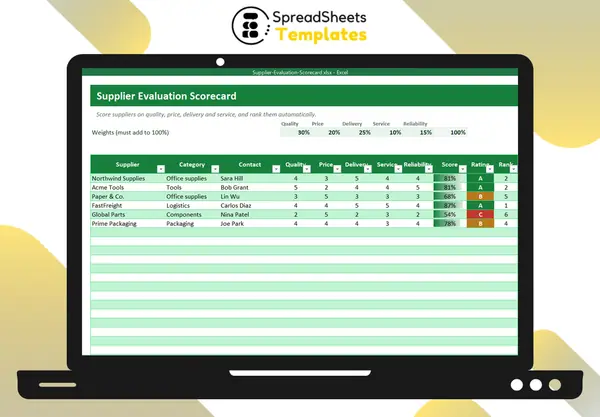
Choose criteria, set weights, score suppliers from 1 to 5 and use the ranking to negotiate, develop or replace suppliers.
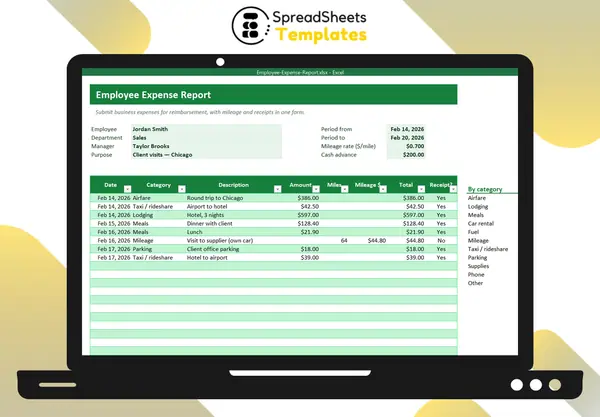
What to include in an expense report, how to handle mileage, receipts and cash advances, and tips to get reimbursed faster.
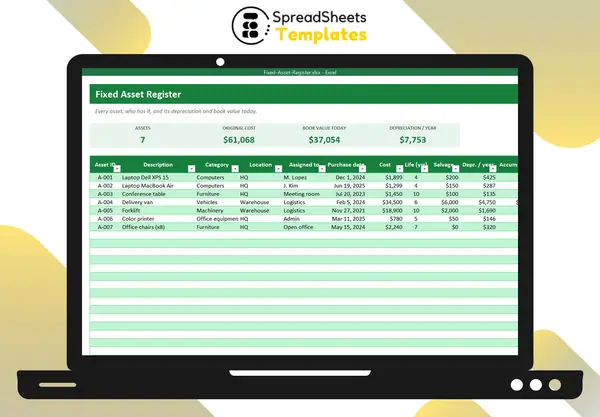
What a fixed asset register is, which fields to track, how straight-line depreciation works and how to keep the list accurate.